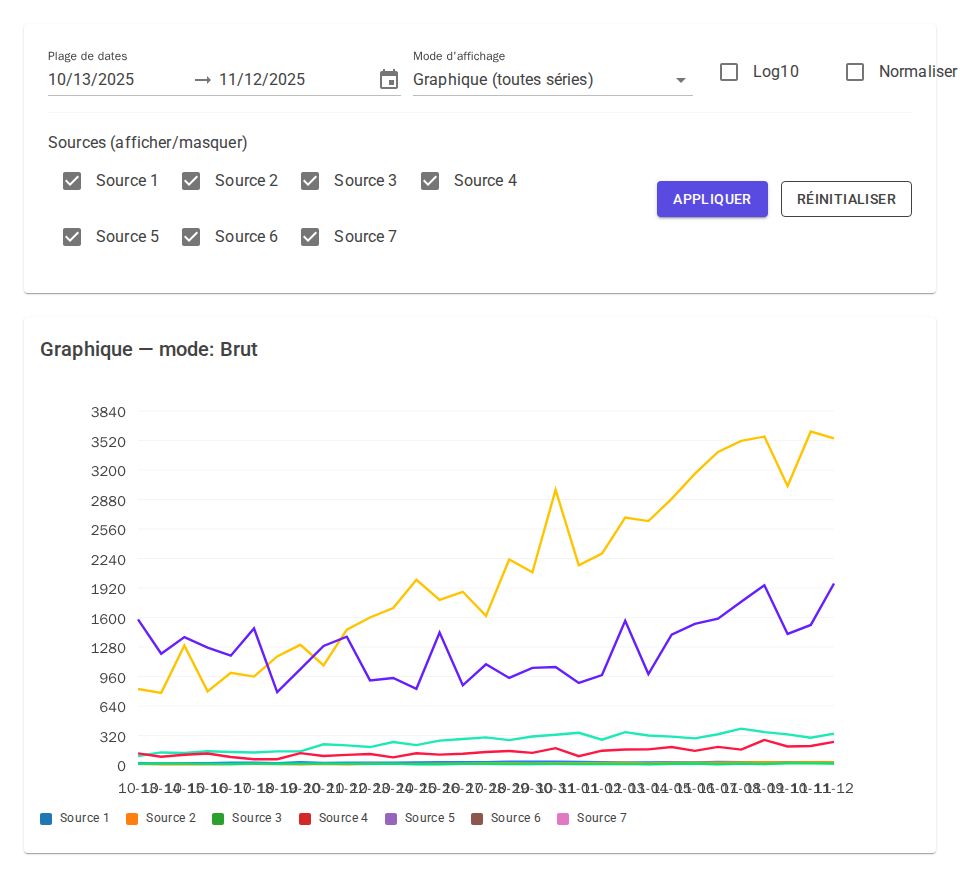
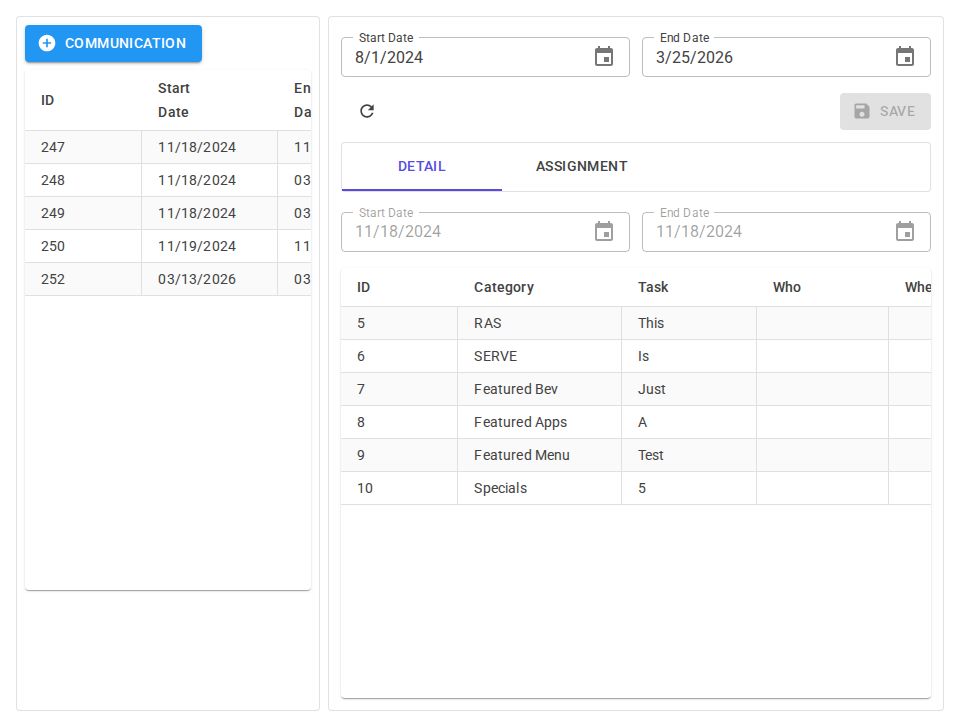
●
LIVE DEMO
Generated using
Instruct UI - An AI for Blazor UI Generation
## What's implemented
- Date range selection (MudDateRangePicker), display mode selector (MudSelect) and boolean toggles (MudCheckBox) with Apply/Reset buttons.
- Per-series visibility controls and color swatches.
- Multi-series MudChart line charts with options: raw, normalized (0-1), log10 transform, and separate per-series charts.
- Table view rendering visible dates and values (HTML table with striped rows).
## Key components
- MudDateRangePicker, MudSelect, MudCheckBox, MudButton, MudChart, MudGrid, MudPaper, MudText
- ChartSeries, ChartOptions, StateHasChanged
- SeriesModel and DataPointModel (simple POCOs for series and points)
## How it works
- Mock data is generated in OnInitialized via GenerateMockData into a List<SeriesModel>.
- Controls bind to component state using @bind-DateRange and @bind-Value (e.g., _dateRange, _displayMode, _useLogTransform, _normalize, _separateCharts) and per-series IsVisible flags.
- ApplyTransform computes _visibleDates and _xAxisLabels, then builds _chartSeries by sampling each SeriesModel over the visible dates.
- Log transform (Math.Log10) and normalization (min-max to 0..1) are applied in ApplyTransform based on flags or selected display mode.
- Table view iterates _visibleDates and visible series to render rows; chart view passes ChartSeries and XAxis labels to MudChart.
- StateHasChanged is invoked after transforms to update the UI.
## Styling
- Uses MudBlazor components and layout (MudGrid, MudItem, MudPaper). Responsiveness is handled by MudGrid breakpoints (xs/md/lg).
- The data table uses Bootstrap-like classes present in markup ("table table-striped table-sm"). No external CSS files are required by the demo.
- Chart appearance is controlled by ChartOptions (tooltips, legend, line stroke) and per-series color strings.
## Reuse steps
1. Install MudBlazor NuGet and register services (e.g., builder.Services.AddMudServices()).
2. Import MudBlazor in _Imports.razor or component file.
3. Copy SeriesModel/DataPointModel and the TimeSeriesVisualizer.razor component into the project; adjust namespaces and route.
4. Replace GenerateMockData with real API/service calls and call ApplyTransform after data load.
5. Tune ChartOptions, color selection, and enable server-side paging or downsampling for large datasets.
## Limitations & next steps
- Demo uses in-memory mock data and no backend or authentication; it is a single-page example generated by Instruct UI.
- Large time series may require downsampling, pagination, or async loading to avoid rendering bottlenecks.
- Add CSV export, axis formatting, zoom/brush interactions, accessibility attributes, and error handling when integrating with a real API.